


Wydawcy
Katalog tematyczny
- Archeologia (109)
- Ekonomia, finanse, business (13704)
- Filozofia (1445)
- Historia (3040)
- Języki i językoznawstwo (2356)
- Lifestyle, hobby i rozrywka (475)
- Medycyna (9704)
- Nauki humanistyczne (4)
- Nauki o Ziemi i środowisku (2638)
- Nauki ścisłe (20412)
- Astronomia (294)
- Biologia (5119)
- Chemia (6540)
- Fizyka (3309)
- Matematyka (4574)
- Algebra (171)
- Analiza matematyczna (902)
- Filozofia matematyki (1)
- Geometria (237)
- Historia matematyki (57)
- Kombinatoryka, teoria grafów (67)
- Matematyka dyskretna (35)
- Matematyka stosowana (555)
- Optymalizacja (104)
- Podstawy matematyki (129)
- Statystyka, prawdopodobieństwo (296)
- Teoria grup (63)
- Teoria liczb (77)
- Topologia (66)
- Nauki ścisłe, ogólnie (503)
- Nauki społeczne (8486)
- Nauki techniczne (13450)
- Prawo (1696)
- Publikacje informacyjne i interdyscyplinarne (1288)
- Religia i wierzenia (917)
- Technika komputerowa (4067)
- Zdrowie, relacje międzyludzkie i rozwój osobisty (657)





Informacje szczegółowe o książce
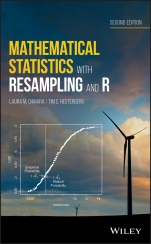
Mathematical Statistics with Resampling and R
ISBN 9781119416548
Autor: Laura M. Chihara, Tim C. Hesterberg
Wydawca: Wiley
Dostępność: 3-6 tygodni
Cena: 691,95 zł
Przed złożeniem zamówienia prosimy o kontakt mailowy celem potwierdzenia ceny.
ISBN13: |
9781119416548 |
ISBN10: |
111941654X |
Autor: |
Laura M. Chihara, Tim C. Hesterberg |
Oprawa: |
Hardback |
Rok Wydania: |
2018-11-30 |
Numer Wydania: |
2nd Edition |
Ilość stron: |
560 |
Wymiary: |
236x158 |
Tematy: |
PB |
This thoroughly updated second edition combines the latest software applications with the benefits of modern resampling techniques
Resampling helps students understand the meaning of sampling distributions, sampling variability, P–values, hypothesis tests, and confidence intervals. The second edition of Mathematical Statistics with Resampling and R combines modern resampling techniques and mathematical statistics. This book has been classroom–tested to ensure an accessible presentation, uses the powerful and flexible computer language R for data analysis and explores the benefits of modern resampling techniques.
This book offers an introduction to permutation tests and bootstrap methods that can serve to motivate classical inference methods. The book strikes a balance between theory, computing, and applications, and the new edition explores additional topics including consulting, paired t test, ANOVA and Google Interview Questions. Throughout the book, new and updated case studies are included representing a diverse range of subjects such as flight delays, birth weights of babies, and telephone company repair times. These illustrate the relevance of the real–world applications of the material. This new edition:
Puts the focus on statistical consulting that emphasizes giving a client an understanding of data and goes beyond typical expectations
Presents new material on topics such as the paired t test, Fisher′s Exact Test and the EM algorithm
Offers a new section on "Google Interview Questions" that illustrates statistical thinking
Provides a new chapter on ANOVA
Contains more exercises and updated case studies, data sets, and R code
Written for undergraduate students in a mathematical statistics course as well as practitioners and researchers, the second edition of Mathematical Statistics with Resampling and R presents a revised and updated guide for applying the most current resampling techniques to mathematical statistics.
Dedication
Preface
Chapter 1: Data and Case Studies
1.1 Case study: Flight Delays
1.2 Case Study: Birth Weights of Babies
1.3 Case Study: Verizon Repair Times
1.4 Case Study: Iowa Recidivism
1.5 Sampling
1.6 Parameters and Statistics
1.7 Case Study: General Social Survey
1.8 Sample Surveys
1.9 Case Study: Beer and Hot Wings
1.10 Case Study: Black Spruce Seedlings
1.11 Studies
1.12 Google Interview Question Mobile Ads Optimization
Exercises
Chapter 2: Exploratory Data Analysis 2
2.1 Basic Plots
2.2 Numeric Summaries
2.2.1 Center
2.2.2 Spread
2.2.3 Shape
2.3 Boxplots
2.4 Quantiles and Normal Quantile Plots
2.5 Empirical Cumulative Distribution Functions
2.6 Scatter Plots
2.7 Skewness and kurtosis
Exercises
Chapter 3: Introduction to Hypothesis Testing: Permutation Tests
3.1 Introduction to Hypothesis Testing
3.2 Hypotheses
3.3 Permutation Tests
3.3.1 Implementation issues
3.3.2 One–sided and two–sided tests
3.3.3 Other statistics
3.3.4 Assumptions
3.3.5 Remark on Terminology
3.4 Matched Pairs
Exercises
Chapter 4: Sampling Distributions
4.1 Sampling Distributions
4.2 Calculating Sampling Distributions
4.3 The Central Limit Theorem
4.3.1 CLT for Binomial Data
4.3.2 Continuity Correction for Discrete Random Variables
4.3.3 Accuracy of the Central Limit Theorem∗
4.3.4 CLT for Sampling without Replacement
Exercises
Chapter 5: Introduction to Confidence Intervals: The Bootstrap
5.1 Introduction to the Bootstrap
5.2 The Plug–In Principle
5.2.1 Estimating the Population Distribution
5.2.2 How Useful Is the Bootstrap Distribution?
5.3 Bootstrap Percentile Intervals
5.4 Two Sample Bootstrap
5.5 Other Statistics
5.6 Bias
5.7 Monte Carlo Sampling: the Second Bootstrap Principle
5.8 Accuracy of Bootstrap Distributions
5.8.1 Sample Mean, Large Sample Size:
5.8.2 Sample Mean: Small Sample Size
5.8.3 Sample Median
5.8.4 Mean Variance Relationship
5.9 How many bootstrap samples are needed?
Exercises
Chapter 6: Estimation
6.1 Maximum Likelihood Estimation
6.1.1 Maximum Likelihood for Discrete Distributions
6.1.2 Maximum Likelihood for Continuous Distributions
6.1.3 Maximum Likelihood for Multiple Parameters
6.2 Method of Moments
6.3 Properties of Estimators
6.3.1 Unbiasedness
6.3.2 Efficiency
6.3.3 Mean Square Error
6.3.4 Consistency
6.3.5 Transformation Invariance∗
6.3.6 Asymptotic Normality of MLE∗
6.4 Statistical Practice
Exercises
Chapter 7: More Confidence Intervals
7.1 Confidence Intervals for Means
7.1.1 Confidence Intervals for a Mean, Variance Known
7.1.2 Confidence Intervals for a Mean, Variance Unknown
7.1.3 Confidence Intervals for a Difference in Means
7.1.4 Matched Pairs, revisited
7.2 Confidence Intervals in General
7.2.1 Location and Scale Parameters∗
7.3 One–Sided Confidence Intervals
7.4 Confidence Intervals for Proportions
7.4.1 The Agresti–Coull Interval for a Proportion
7.4.2 Confidence Interval for the Difference of Proportions
7.5 Bootstrap Confidence Intervals
7.5.1 t Confidence Interval using Bootstrap Standard Error
7.5.2 Bootstrap t Confidence Intervals
7.5.3 Comparing Bootstrap t and Formula t Confidence Intervals
7.6 Confidence Interval Properties
Exercises
Chapter 8: More Hypothesis Testing
8.1 Hypothesis Tests for Means and Proportions: One Population
8.1.1 A Single Mean
8.1.2 One Proportion
8.2 Bootstrap T Tests
8.3 Hypothesis Tests for Means and Proportions: Two Populations
8.3.1 Comparing Two Means
8.3.2 Comparing Two Proportions
8.4 Type I and Type II errors
8.4.1 Type I errors
8.4.2 Type II errors and power
8.4.3 P–Values versus Critical Regions
8.5 Interpreting Test Results
8.5.1 P–values
8.5.2 On Significance
8.5.3 Adjustments for Multiple Testing
8.6 Likelihood Ratio Tests
8.6.1 Simple Hypotheses and the Neyman Pearson Lemma
8.6.2 Likelihood Ratio Tests for Composite Hypotheses
8.7 Statistical Practice
Exercises
Chapter 9: Regression
9.1 Covariance
9.2 Correlation
9.3 Least Squares Regression
9.3.1 Regression toward the Mean
9.3.2 Variation
9.3.3 Diagnostics
9.3.4 Multiple Regression
9.4 The Simple Linear Model
9.4.1 Inference for and
9.4.2 Inference for the Response
9.4.3 Comments about Assumptions for the Linear Model
9.5 Resampling Correlation and Regression
9.6 Logistic Regression
9.6.1 Inference for Logistic Regression
Exercises
Chapter 10: Categorical Data
10.1 Independence in Contingency Tables
10.2 Permutation Test of Independence
10.3 Chi–Square Test of Independence
10.3.1 Model for Chi–Square Test of Independence
10.3.2 2 x 2 Tables
10.3.3 Fisher s Exact Test
10.3.4 Conditioning
10.4 Chi–Square Test of Homogeneity
10.5 Goodness–of–Fit Tests
10.5.1 All Parameters Known
10.5.2 Some Parameters Estimated
10.6 Chi–square and the likelihood ratio∗
Exercises
Chapter 11: Bayesian Methods
11.1 Bayes Theorem
11.2 Binomial Data, Discrete Prior Distributions
11.3 Binomial Data, Continuous Prior Distributions
11.4 Continuous Data
11.5 Sequential Data
Exercises
Chapter 12 One–Way ANOVA
12.1 Comparing three or more populations
12.1.1 The ANOVA F Test
12.1.2 A Permutation Test Approach
Exercises
Chapter 13: Additional Topics
13.1 Smoothed Bootstrap
13.1.1 Kernel Density Estimate
13.2 Parametric Bootstrap
13.3 The Delta Method
13.4 Stratified Sampling
13.5 Computational Issues in Bayesian Analysis
13.6 Monte Carlo Integration
13.7 Importance Sampling
13.7.1 Ratio Estimate for Importance Sampling
13.7.2 Importance Sampling in Bayesian Applications
13.8 The EM Algorithm
13.8.1 General Background
Exercises
A Review of Probability
A.1 Basic Probability
A.2 Mean and Variance
A.3 The Normal Distribution
A.4 The Mean of a Sample of Random Variables
A.5 Sums of Normal Random Variables
A.6 The Law of Averages
A.7 Higher moments and the moment generating function
B Probability Distributions
B.1 The Bernoulli and Binomial Distributions
B.2 The Multinomial Distribution
B.3 The Geometric Distribution
B.4 The Negative Binomial Distribution
B.5 The Hypergeometric Distribution
B.6 The Poisson Distribution
B.7 The Uniform Distribution
B.8 The Exponential Distribution
B.9 The Gamma Distribution
B.10 The Chi–square Distribution
B.11 The Student s t Distribution
B.12 The Beta Distribution
B.13 The F Distribution
Exercises
C Distributions Quick Reference
Problem Solutions
Bibliography
Index
Laura M. Chihara, PhD, is Professor of Mathematics and Statistics at Carleton College. She has extensive experience teaching mathematics and statistics and has worked as Educational Services Supervisor at Insightful Corporation.
Tim C. Hesterberg, PhD, is Senior Data Scientist at Google. He was a senior research scientist for Insightful Corporation and led the development of S+Resample and other S+ and R software.
Koszyk
Książek w koszyku: 0 szt.
Wartość zakupów: 0,00 zł
Informacje


Kontakt
Gambit
Centrum Oprogramowania
i Szkoleń Sp. z o.o.
Al. Pokoju 29b/22-24
31-564 Kraków
Siedziba Księgarni
ul. Kordylewskiego 1
31-542 Kraków
+48 12 410 5991
+48 12 410 5987
+48 12 410 5989
Subskrypcje
Administratorem danych osobowych jest firma Gambit COiS Sp. z o.o. Na podany adres będzie wysyłany wyłącznie biuletyn informacyjny.
Autoryzacja płatności

Informacje na temat autoryzacji płatności poprzez PayU.

© Copyright 2012: GAMBIT COiS Sp. z o.o. Wszelkie prawa zastrzeżone.
Projekt i wykonanie: Alchemia Studio Reklamy